
This article summarizes three quantitative pieces of analysis using large transaction-level datasets that the CMA undertook in a recent market study into online platforms and digital advertising. These are: a comparison of Google and Bing’s search advertising prices; an analysis of Google’s fees from providing advertising intermediation services; and an assessment of the value of targeting digital advertising through the use of third-party cookies. We find that Google’s search advertising prices are 30-40 percent higher than Bing’s on a like for like basis, while Google’s fees for advertising intermediation services are broadly comparable with those of its competitors. Regarding the value of user data for targeting, we find that blocking access to third-party cookies reduces publisher revenue by around 70 percent. We expect that this form of analysis will become an increasingly important aspect of regulatory oversight of digital markets in the future, as it can provide highly valuable insights into the working of the often-opaque algorithms that increasingly drive digital market outcomes.
By Simeon Thornton, Chris Jenkins, Giacomo Mason & Dan Griffiths1
I. INTRODUCTION
The Competition and Markets Authority (“CMA”) conducted a market study into online platforms and digital advertising in the UK between July 2019 and July 2020.2 Our aim was to assess the state of competition in the sector, and to analyze the sources and implications of market power of the large platforms funded by digital advertising – notably Google and Facebook. The market study concluded that there was a need for pro-competition ex ante regulation of digital platforms to address the exploitation of market power by the large platforms and to implement remedies to increase competition in specific markets.
Some other recent studies have drawn similar high-level conclusions and also made a case for regulatory reform, including the Furman and Stigler Center reviews in the UK and U.S. respectively.3 However, one thing our study was able to do that was not possible in these other exercises was to undertake detailed empirical analysis of very large-scale datasets in order to assess the extent of the concerns in relation to online platforms and the size of the detriment arising from them. This sort of in-depth analysis can provide a robust quantitative evidence base for assessing the case for interventions to address competition concerns in relation to online platforms, and is required in order to move beyond high level prescriptions and diagnoses to detailed design and implementation of the new regulatory regime.
When conducting a market study, the CMA has statutory information-gathering powers to require parties to provide data and other information. Using these powers, we compiled several large transaction-level datasets which allowed us to carry out detailed empirical analysis in a number of areas.4 This article summarizes three quantitative pieces of analysis we undertook in the study which use large transaction-level datasets and which focus specifically on the behavior of Google in search and display advertising markets:
- A “like for like” comparison of the search advertising prices of Google and Bing;
- An analysis of Google’s fees from providing advertising intermediation services; and
- An assessment of the value of targeting digital advertising through the use of third-party cookies
For each exercise, we set out the objectives of the analysis, summarize the data collected and the analysis undertaken, and discuss the results and implications for the study findings. Part of our aim in the market study was to demonstrate the type of data analysis that might be carried out by a future regulator of digital markets, and in the conclusion, we set out some considerations that should be taken into account in undertaking this future work.
II. COMPARISON OF GOOGLE AND BING SEARCH ADVERTISING PRICES
A. Objectives of the Analysis
A key question for our study was whether the market power of the large platforms leads to higher prices for advertisers. Consumers using online platforms such as Google and Facebook typically do not pay directly for the service; instead they provide attention and data which are monetized by the platforms through the sale of advertising. We would expect platforms with market power to be able to earn higher returns than their competitors from digital advertising.5
We tested this hypothesis in relation to search advertising by comparing the UK search advertising prices of Google, which accounts for more than 90 percent of search queries and search advertising revenues in the UK, with those of Bing, its main competitor in the UK, which has less than 10 percent of revenues and queries in the UK.
Google, Bing and other search engines sell advertising based on the search query entered by the user. Advertisers bid to display adverts in response to specific search “keywords.” When a user enters a particular search query, the search engine determines which advert(s) to show using a real-time auction, taking account of the price bid by the advertiser, relevance of the advert to the search query, and other quality factors. Search adverts are typically sold on a cost per click (“CPC”) basis, where the advertiser only pays if a user clicks on the ad link.
The main challenge for our analysis was how to compare prices on a like-for-like basis. CPC varies significantly by search query (i.e. some search queries have much higher commercial value than others), so a simple comparison of average CPC across all search terms would be affected by differences in the mix of search queries seen by Google and Bing. Similarly, we would expect CPC to vary based on the position of the ad on the page (i.e. a higher ad position is more valuable), and on the device type used (mobile vs desktop). We therefore collected transaction data on search events from Google and Bing as described below, to allow us to control for these factors and identify price differences on a more comparable basis. To our knowledge, this is the first time an analysis of this type has been carried out using a comprehensive dataset from more than one party, allowing for like-for-like comparisons to be made.
B. Data Collected
The CMA collected data for all the (3 – 4 billion) search events made in the UK on Google and Bing during a single week in 2020. For the purposes of the analysis, each search that is undertaken on a search engine is regarded as a “search event.” The text that is associated with a search event is a “query.” Many queries are associated with multiple search events. The set of queries that remain once duplicates have been removed are “distinct queries.” The “frequency” of a distinct query is how many times it appears in the dataset.
For each search event, the CMA could observe: (i) basic characteristics of the user’s device, such as operating system platform (mobile, tablet, or desktop) and browser; (ii) number of text ads (ad load), number of clicks, and total revenue; (iii) for the top text ad (the one appearing in the highest position), the cost per click (“CPC”) and the price-bid ratio (“PBR”) – defined as the ratio between the amount actually paid by the advertiser and the what the winning advertiser had actually bid. CPC and PBR were only observed when the top ad was clicked.
C. Results and Implications
We compared the prices of queries that were observed by both Google and Bing, and calculated the results separately for queries on desktop and mobile, to yield results that can be compared “like-for-like” on a query basis. This allowed us to isolate differences in market outcomes, rather than capturing differences in the scale or distribution of queries across Google and Bing. The results from our analysis were striking. We found that top text ads on Google have a CPC that is on average 30 to 40 percent higher than Bing on both desktop and mobile, for comparable queries where the top ad was clicked.
Differences in the CPC of Google and Bing at the query level may be in part driven by differences in the perceived value of a click between Google and Bing. This may be due, for example, to differences in advertiser or audience composition (e.g. one search engine attracts more valuable users and/or advertisers) or differences in the ability of the search engine to interpret search intent and serve relevant ad results that are more likely to lead to conversions.
To address this issue, we also compared PBRs for Google and Bing, which measure the difference between the winning bid and the price paid. Insofar as the bid is an indicator of the advertiser’s willingness to pay (i.e. the value it expects to derive from a click),6 the PBR controls for any difference in the value of a click on Google as opposed to Bing. A higher PBR means that the platform is able to extract more of the rent or surplus value from the advertising opportunity, and a lower PBR means that the advertiser retains more of the surplus value. Our results show that the PBR for searches on Google is [20 – 30 percent] higher than that of Bing on a like for like basis on mobile and [10 – 20 percent] higher on desktop, indicating that Google is more effective at extracting surplus value from the advertiser than Bing.
Overall, these results support the hypothesis that Google’s market power gives it an ability to raise prices above the competitive level.7 Given that over £7bn was spent on search advertising in the UK in 2019, higher advertising prices are likely to result in considerable detriment to UK consumers in the form of higher prices for goods and services that use search advertising, including hotels, flights, and consumer electronics.
In addition to allowing for the comparison of Google and Bing’s prices, our analysis shed light on a number of other characteristics of search advertising prices in the UK. For example, we found that ads on less common queries tended to be more expensive than ads on more common queries and that CPCs on desktop were more expensive than CPCs on mobile.
Furthermore, our analysis allowed us to quantify the extent to which Google enjoys greater access than Bing to uncommon “tail” queries, which can be of particular value in training algorithms to improve the quality and relevance of search results. We found that, of the queries that Google only saw once or twice, only 1.0 percent were in the Bing dataset, while of the queries that Bing only saw once or twice, 31.5 percent were in the Google dataset. This is shown in the figure below.
Figure 1: Distribution of the percentage of Google search events which were for queries seen by Bing, and vice versa, by the frequency of their search query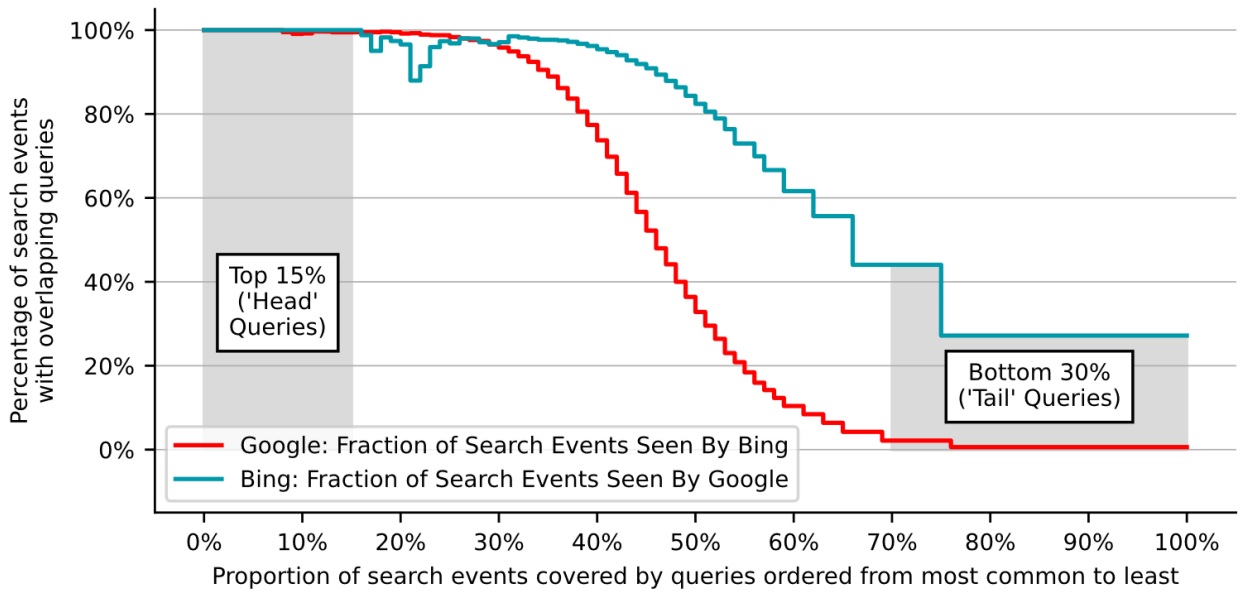
We define the head as the 15 percent of queries seen most often in a dataset and the tail as the 30 percent of queries seen least often.
This evidence is supportive of our assessment of Google’s scale advantage in search. The scale and variety of click-and-query data seen by Google underpins its ability to provide timely and relevant search results. The benefits of scale are particularly large for less common queries, where Google’s advantage over Bing is more significant. In view of the importance of search relevance to consumers and keyword coverage to advertisers, we found that a lack of comparable scale in click-and-query data is likely to be a key factor that limits the ability of other search engines to compete with Google.
III. ANALYSIS OF GOOGLE’S AD TECH FEE RATES
A. Objectives of the Analysis
A second piece of analysis conducted during the market study related to open display advertising. In this part of the market, online publishers sell advertising in real time via a chain of intermediaries (the “adtech stack”) that bring together demand from advertisers and run auctions to decide which ad to show to a specific user on a publisher’s site. Various stakeholders in the CMA’s market study including publishers, advertisers and public bodies expressed concerns regarding the proportion of advertising revenues in open display which accrues to the providers of intermediation services, and the lack of transparency over these payments.
We carried out an aggregate-level analysis based on information requests to a wide range of intermediaries, which found that ad tech intermediation services accounted for at least 35 percent of the amount paid by advertisers. However, there were concerns that this aggregate analysis might not identify so-called “hidden fees” which could arise if ad tech intermediaries were able to exploit a lack of transparency to take additional margins at different points in the ad tech chain.
We therefore gathered transaction-level data from Google to investigate in more detail the fees it earned at different points in the ad tech chain. While this could only tell us about Google’s fees rather than those charged by other intermediaries, Google is the largest player in all the main parts of the ad tech chain, so the analysis was informative about a significant portion of the market.8 The fact that Google operates in all parts of the chain also meant that we could trace a large number of individual transactions from “end to end,” allowing us to observe all payments including any hidden fees.
B. Data Collected
The CMA obtained from Google a dataset containing event-level information generated by Google Ad Manager in the seven-day period beginning March 8, 2020 Pacific Time (“PDT”).9 The dataset covers all Google Ad Manager open auction web traffic in the UK (based on user location) for that week, amounting to several billion observations.
The dataset is at the bid level, including, for each bid, the DSP, the amount bid, any bid floor, and the result of the auction. For the winning bid in each auction, information about buy- and sell-side fees is also available. Finally, the dataset includes user characteristics (operating system, platform, browser) and the domain of the page where the auction took place. This data allowed us to observe the end-to-end payments from advertiser to publisher where Google intermediaries were used – including any possible “hidden fees” which would not be visible to either the advertiser or the publisher
C. Results and Implications
Our analysis found that, in transactions where both Google Ads and Ad Manager (“AdX”) are used, Google’s overall take rate was approximately 30 percent of advertiser spend. Overall, Google take rates were broadly in line with, or slightly lower than, aggregate market-wide fee estimates from other sources.
This data allowed us to investigate an additional concern raised by stakeholders, notably UK news publishers, that Google Ads has an informational advantage over other DSPs that allows it to shade its bids in the auction,10 such that the Google Ads winning margin (its winning bid minus the maximum of the second highest bid or floor price) would be systematically lower than that of other DSPs. Such an outcome could be thought of as a “hidden fee,” as Google Ads would be able to maximize the difference between the winning bid in the auction that it holds among buyers on the platform and the bid that it submits to the unified auction.
To shed more light on these concerns, we calculated the margin between the winning bid and the second highest bid for Google and non-Google DSPs, to test whether Google Ads was systematically able to win with a lower margin over the second highest bid compared to other DSPs. We did not find clear evidence that Google’s winning margins were systematically lower than non-Google DSPs. In absolute terms there was some evidence that Google Ads is able to achieve lower winning margins than other DSPs. However, in proportionate terms its winning margins were higher than other those of other bidders.11
Overall, the results of our analysis in relation to Google’s adtech fees stand in contrast to those regarding Google’s search advertising prices, in that we did not find evidence that it systematically charged higher fees than its competitors, notwithstanding its market power in different segments of adtech intermediation. We noted in the study that Google’s position was still a source of concern, particularly if it led to reduced dynamic competition and innovation over time, and that Google retained the ability and incentive to raise fee levels in the future.
IV. THE VALUE OF TARGETING WITH THIRD PARTY COOKIES
A. Objectives of the Analysis
The third piece of analysis related to the value of user data in digital advertising. One of the defining characteristics of digital advertising is the ability to target advertising at specific users or groups of users based on information about their characteristics, preferences and interests. This form of “personalized” advertising is particularly important in relation to display and video advertising. Advertisers want to target advertising at consumers for whom their adverts are more likely to be relevant, reducing deadweight loss and increasing the likelihood of conversion, i.e. achieving a sale as a result of a consumer seeing an advert.
We sought to assess the value of user data by analyzing how access to it translated into higher advertising prices. This analysis helped us to understand how the large platforms’ extensive access to data on consumers’ preferences and past browsing behavior might act as a source of competitive advantage over smaller players and online publishers. Further, it allowed us to assess how future changes to the market – introduced either by large platforms or by regulatory authorities – that changed participants’ access to user data would affect their ability to generate revenue through serving targeted advertising.
Our analysis was based on observing the impact on advertising revenues of “switching off” access to third party cookies, which are a common means of tracking users across the web and targeting them based on their interests.
B. Data Collected
In the summer of 2019, Google ran a global randomized controlled trial (“RCT”) to assess the short-run impact of disabling third-party cookies on publisher revenues from display ads. The CMA obtained the data for the UK subset of this experiment and expanded the analysis, to shed more light on the value of cookies in targeted advertising.
The dataset contained a few million impressions where Google was operating on the demand and/or supply side. These impressions were randomly sampled from Google’s traffic in the UK, and allocated with equal probability to a control group (the “business as usual” case) and an intervention group, where Google’s systems were prevented from accessing the information associated to each cookie ID. For each impression, we observed advertiser payments and publisher revenue for the winning bid, user characteristics (operating system, platform, browser, cookie age) and the domain of the page where the auction took place.
The dataset was smaller than the others discussed in this article. Further, it did not originate directly from a data collection request that was designed by the CMA, but was collected by Google as part of an internal experiment. However, the randomization in the RCT design helps to answer research questions of a causal nature, compared to purely observational data.
C. Results and Implications
As part of our analysis, we identified a number of sample selection issues and implemented a different econometric approach to tackling each one.12 Having implemented these, our best estimate was that blocking cookie information reduced average publisher revenue by around 70 percent. Thanks to the availability of rich transaction-level data, we were able to go beyond average effects and investigate whether the effect differs by type of user. We adopted a causal forest approach, which uses machine learning to flexibly account for all possible combinations of user characteristics. We found that the negative effect of blocking cookies on publisher revenue was larger for users with older cookies (and thus with a potentially more complete profile) and was smaller for users navigating with browsers that adopt anti-tracking technologies such as Safari and Firefox.
The results of the experiment make clear that, for individual publishers competing against other publishers that offer personalized inventory using cookies, blocking access to cookie identifiers reduces publisher revenue from users navigating with cookies by a significant amount. This impact is best understood as a short run effect, where the blocking applies to a relatively small subset of impressions in an ecosystem where third-party cookies are the commonplace means of identifying users. A question this experiment cannot answer is what the impact would be in a “long-run market-wide” perspective, where third-party cookies are unavailable throughout the ecosystem. In such a world, the impact on publisher revenue is likely to be mitigated by dynamic responses, for example heavier use of contextual targeting rather than personalized targeting, and alternative methods of cross-site tracking, including fingerprinting.
This analysis proved valuable in helping us understand the importance of Google’s announcement early in 2020 that Chrome browsers will stop support for third-party cookies in the future, restricting the ability of publishers to sell personalized advertising.13 Depending on how the proposals are implemented,14 this decision has the potential to have a significant impact on publishers’ revenues and the CMA has undertaken to discuss this with ICO, alongside a number of other issues relating to the interaction between competition and data protection regulation in digital advertising markets.
V. CONCLUSIONS AND IMPLICATIONS FOR FURTHER WORK
The pieces of quantitative analysis outlined in this paper played an important role in supporting the overall findings of our market study. They provided empirical evidence of the impact of Google’s market power on search advertising prices, shed light on fees paid to ad tech intermediaries and quantified the value of access to personal data on for targeted advertising. This quantitative work is important in evidencing the scale of harm from lack of competition, and in providing the basis for assessing the costs and benefits of potential regulatory interventions.
We expect that this form of analysis will become increasingly important as part of regulatory oversight of digital markets in the future. One of the key characteristics of digital markets is their reliance on real-time processes driven by algorithms, based on access to very large sets of data on the behavior and characteristics of consumers and other market participants. These processes can be very hard for third parties (including regulators) to assess. For example, the way in which auction prices are adjusted to take account of quality cannot be observed purely by interrogating auction outcomes, and transactions in the open display market typically cannot be traced from “end-to-end” – i.e. from the advertiser to the publisher on which an ad is shown. We think that regulators will increasingly need the powers to request and interrogate large datasets from the platforms in order to understand their behavior and to ensure that any regulatory rules designed to prevent exploitation of market power are being complied with.
The experience of carrying out large-scale data analysis during the market study has highlighted some lessons that can inform the future work of the Digital Markets Unit (“DMU”), a body proposed by the Furman Review and the CMA’s market study to regulate the behavior of large online platforms and encourage greater competition in online platform markets. We have found that this type of analysis should be well within the reach of a regulator like the DMU. Thanks to advancements in open-source software, multiple well-known tools are available that can perform data manipulation and statistical analysis. The availability of cheap cloud computing resources allows this type of analysis to be scaled in a mostly seamless fashion, making the processing of large amounts of data possible. These capabilities can be effectively supported by building in-house teams with specialist data science and software development knowledge, whose skills can be leveraged in concert with more traditional specialist profiles already present within competition authorities and regulators.
The right tools and skillsets can enable more ambitious analysis. In the instances described in this paper, we chose to collect transaction-level data rather than asking parties to compute aggregate figures beforehand. This clearly increases the workload on the regulator’s side. However, it has numerous advantages: it provides more insight into online platforms, enabling regulators to understand their dynamics on a deeper level; and it increases flexibility in the analysis, allowing for adjustments rather than being wedded to a fixed, pre-specified analysis. Furthermore, the code generating the analysis can be shared with the parties – which reduces the chance of errors and increases transparency. All of these aspects are likely to be particularly important for the DMU, with its envisaged powers of continuous monitoring, and assessment.
Finally, we note that working with personal or otherwise sensitive data need not be an obstacle to the pursuit of regulatory functions. Throughout the study, we were able to cooperate effectively with parties and minimize the risks connected with transferring and analyzing personal data, for example by anonymizing transaction-level data and encrypting potentially sensitive information such as search engine queries. In more complex cases, privacy-enhancing technologies can be used to enable sharing of information across parties while preserving confidentiality.15
1 Director, CMA, Economics Director, CMA, Data Scientist, CMA, Data Scientist, CMA.
2 CMA (2020), Online platforms and digital advertising market study. Evidence presented in this article is drawn from this study unless otherwise noted.
3 Furman Review (2019), Unlocking digital competition. Stigler Center (2019), Committee on Digital Platforms Final Report.
4 We are grateful to Google and other parties such as Microsoft for their work in collecting the data used in this analysis.
5 The precise mechanisms by which a platform with market power can charge high prices in digital advertising markets is complicated by the fact that prices in these markets are largely set through real time auctions. In Chapter 5 and Appendix Q of the market study final report we discuss a variety of ways in which platforms can influence the prices in these auctions, and conclude that market power will increase a platform’s ability to raise prices compared to a situation in which they were subject to greater competitive pressures.
6 This is more likely to be the case where the advertiser sets a maximum bid directly, as opposed to automated bidding, in which the bid is set according to a Google algorithm. In 2019, [40-50] percent of Google’s UK search advertising revenue came from advertisers using automated bidding, while the remainder set maximum CPC bid limits. The data we collected did not allow us to distinguish automated from advertiser-set bids. This could be explored in further work.
7 We note that the prices currently offered by Bing may not reflect the prices that we would expect to apply in a fully competitive market.
8 In 2019, Google had a share of [90-100] percent of the publisher ad server segment, [80-90] percent of the advertiser ad server segment and shares of [50-60] percent in supply-side platforms (SSPs) and [50-60] percent in demand-side platforms (“DSPs”).
9 In GMT time, the dataset spans from 08:00 on Sunday 8 March to 08:00 on Sunday 15 March.
10 Specifically, the concern is that Google Ads has access to superior data which allows it more accurately to anticipate when it will be the only bidder exceeding the floor price in the first-price unified auction.
11 This result may reflect that Google Ads typically bids for lower valued inventory than other DSPs.
12 These are described in detail in the Annex to Appendix F of the market study report.
13 Chromium Blog, ‘Building a more private web: A path towards making third party cookies obsolete’.
14 Google has undertaken through its Privacy Sandbox project to replace the functionality currently served by cross-site tracking with privacy-conscious approaches to ads targeting and ads conversion measurement.
15 See Royal Society (2019). Protecting Privacy in Practice. The current use, development and limits of Privacy Enhancing Technologies in data analysis.